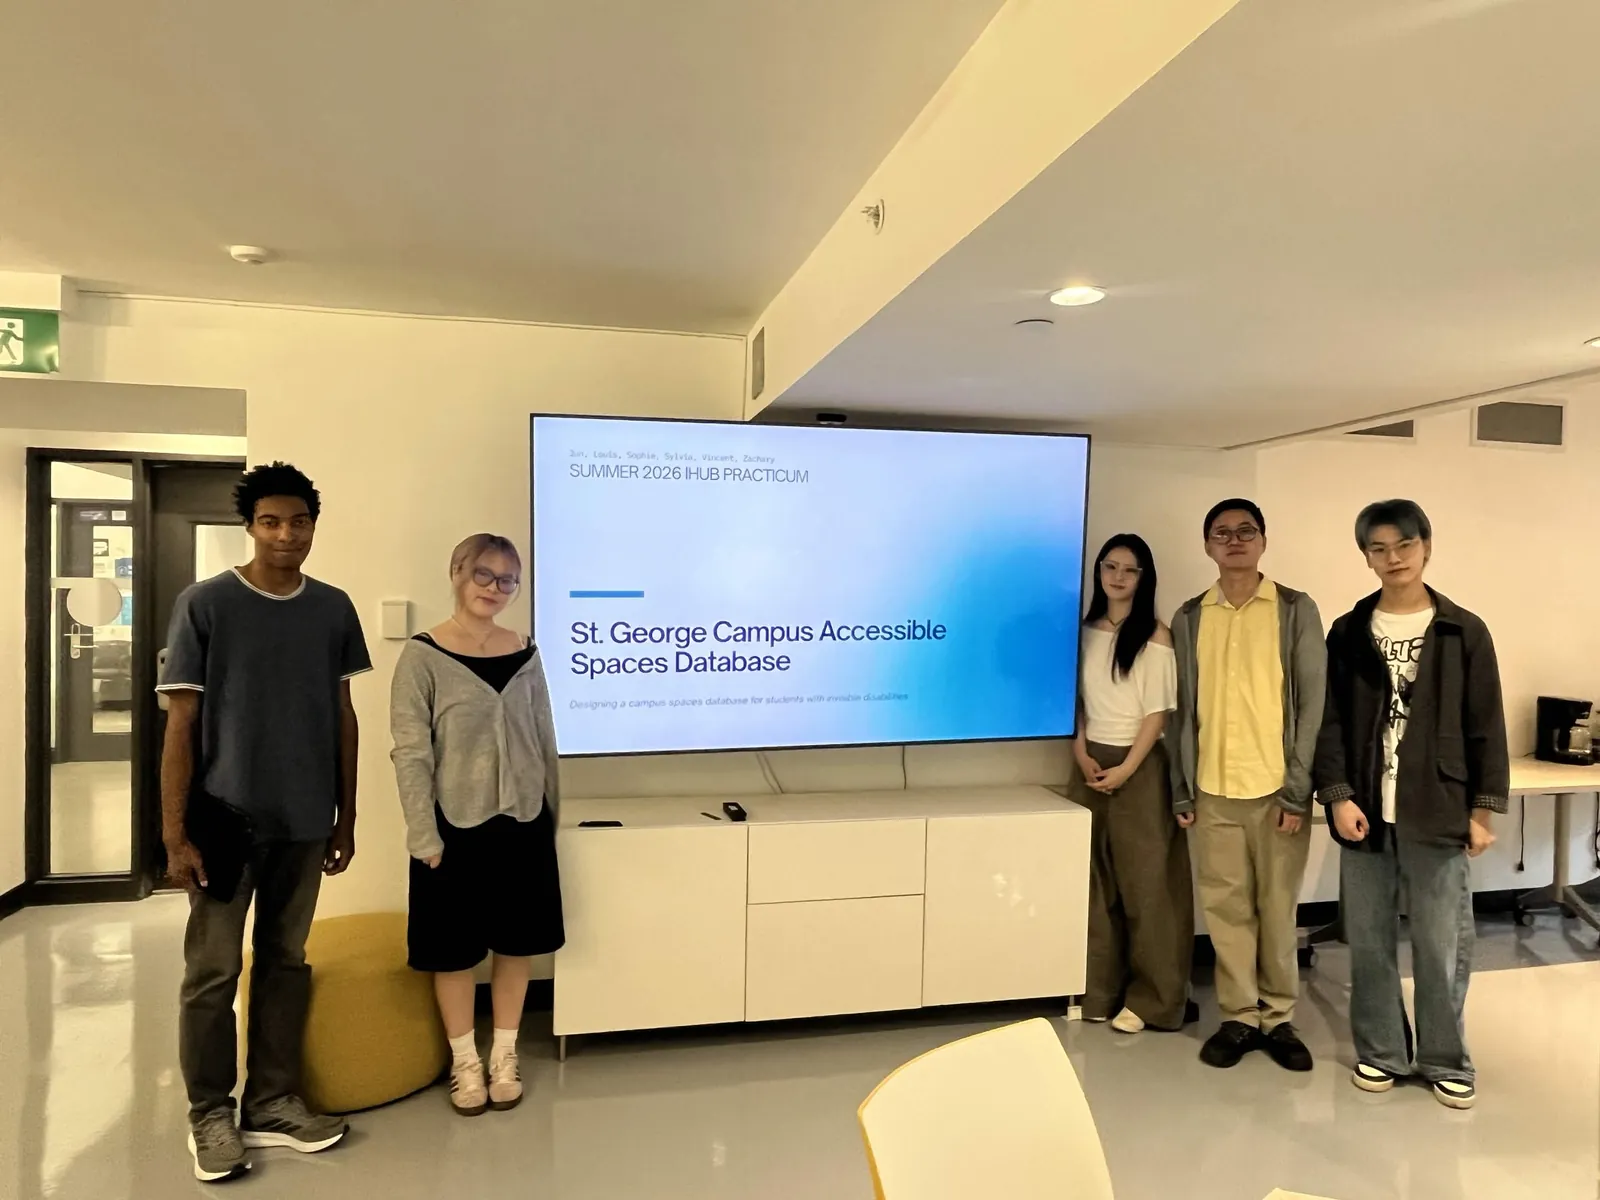
Case study
Accessible Spaces Database
Helping students with invisible disabilities see what a campus space is like before they go.
- Role
- UX/UI Lead
- Team
- 6 students, U of T Innovation Hub
- Timeline
- 2 months, Summer 2026
- Tools
- Figma, FigJam, Notion
Set draft: false at the top of this file when it's ready to publish.
01Overview
Students with invisible disabilities often can’t tell if a campus space will work for them until they get there.
St. George spans 122 buildings, and a room that’s too loud, bright or crowded can be exhausting. The U of T Innovation Hub asked six of us to design a database that students could check before they go.
Led the design of Option B
As UX/UI lead, I set the design direction for our discovery-based prototype and guided teammates on layout and components. Because of this, the screens stayed consistent even though three of us built them in parallel.
Built a design system from scratch
With two teammates, I built a system in Figma based on U of T's brand guidelines. All 21 screens of Option B came from it, so new screens were faster to design. See the system
Ran the design work
I co-built the work plan, set up our Notion tracker and ran weekly design sprints. Everyone knew what they owned each week, and we delivered every milestone on schedule.
02Solution
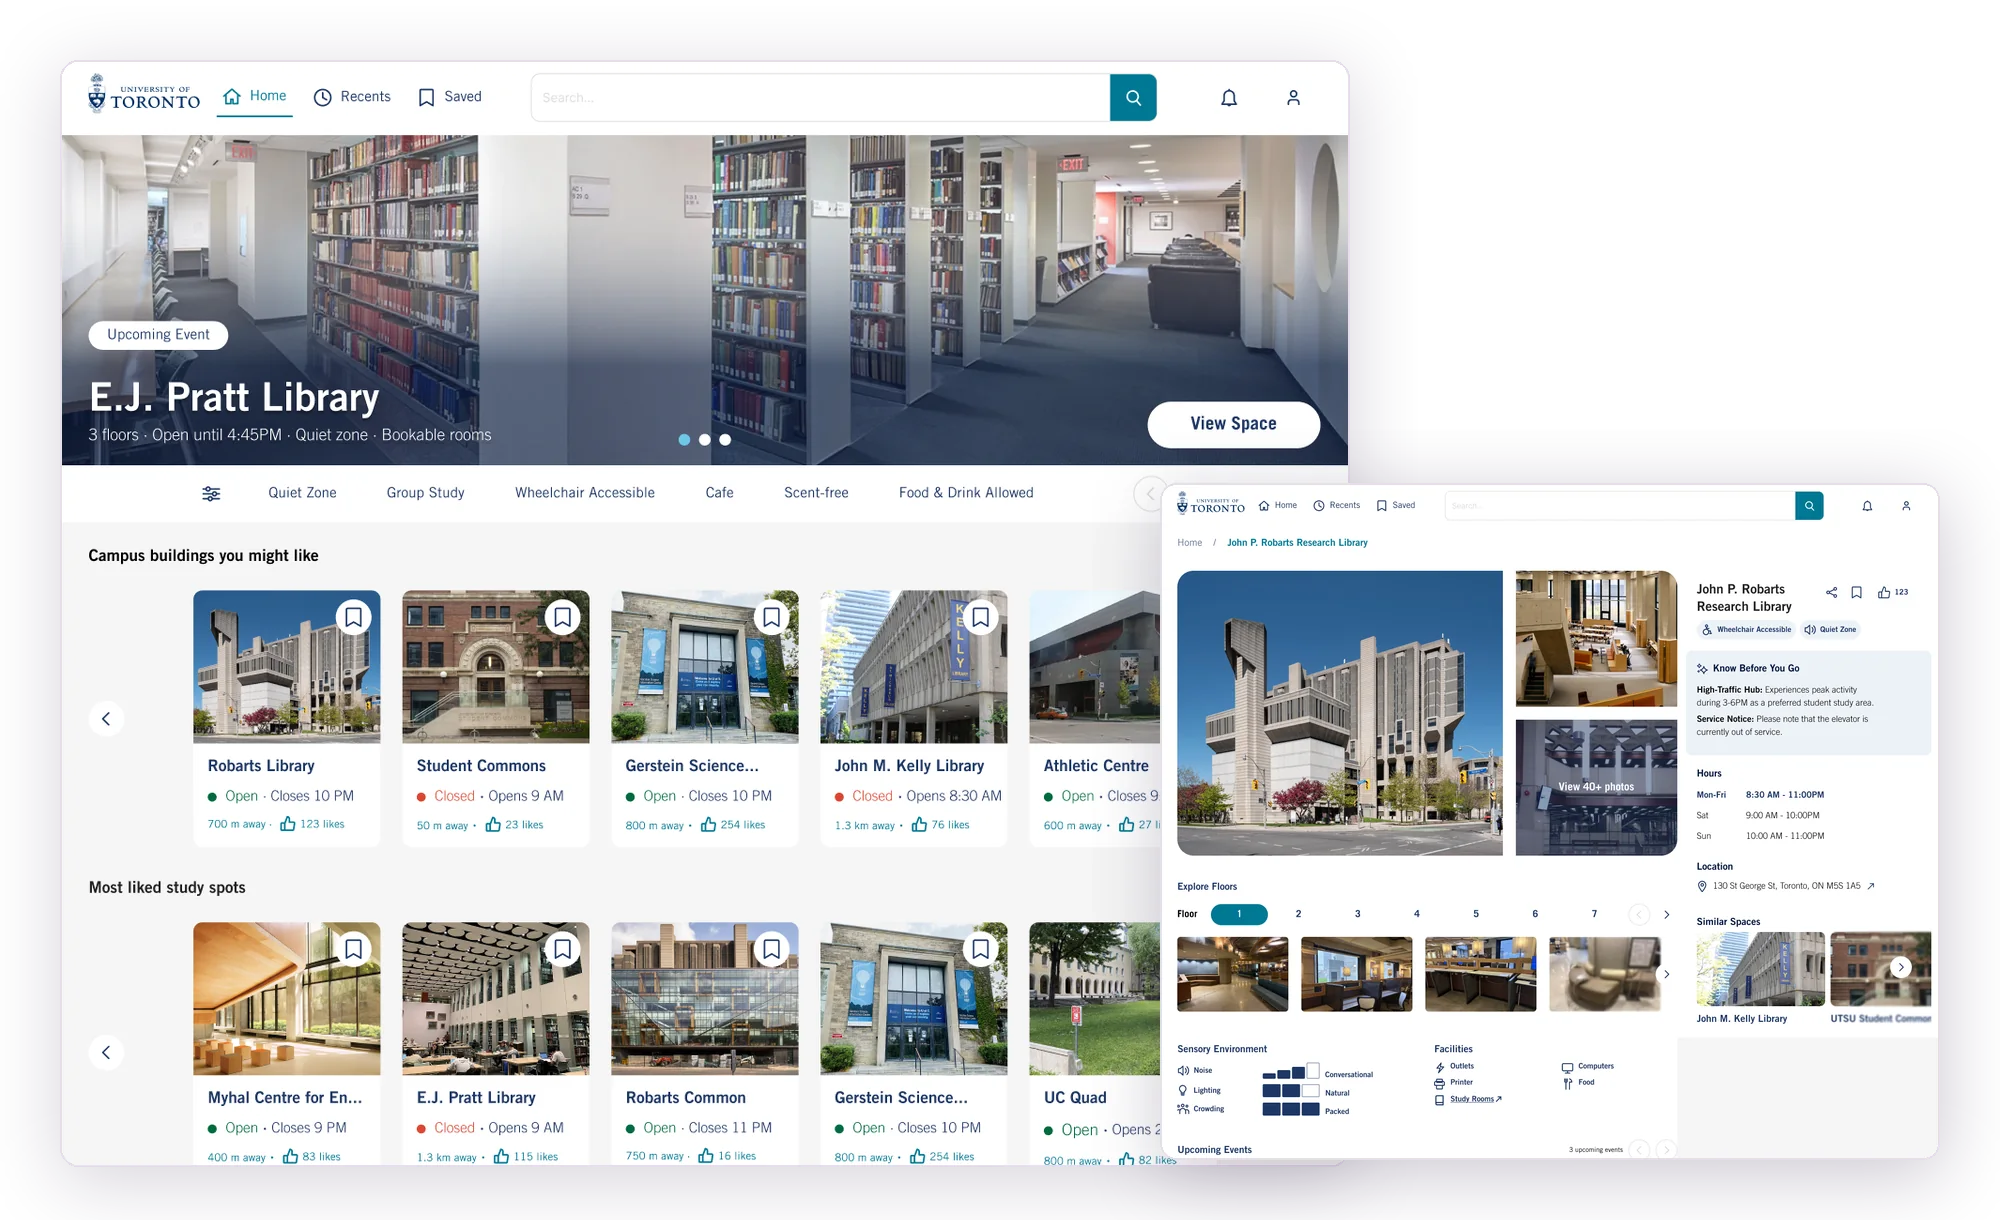
Two database options, designed to explore which approach better fits U of T students.
Some students know exactly what they need, while others want to look around first. Instead of guessing, we designed for both, so the Innovation Hub can test which approach helps students decide faster.
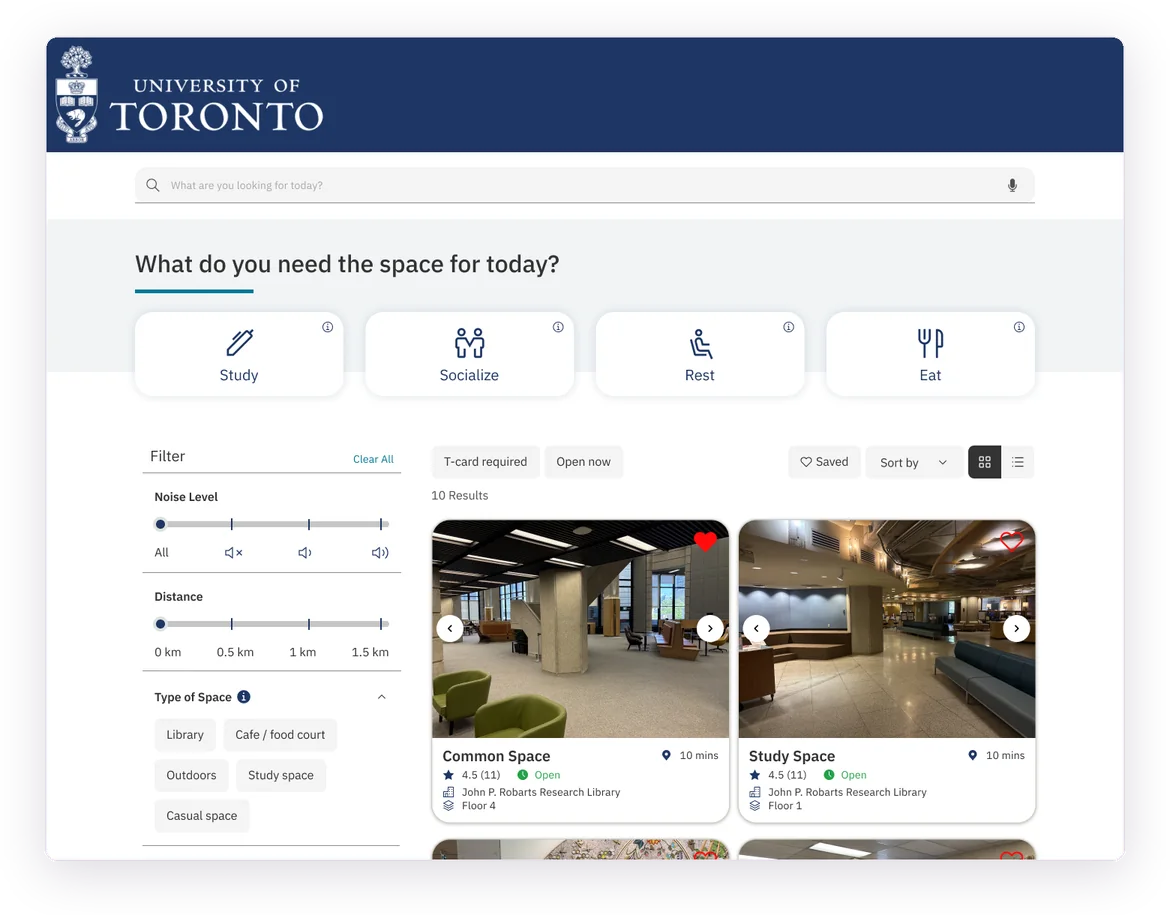
Preference-based search
For students who know what they need, like a quiet room with natural light, and want to narrow their options quickly.
Designed by my teammates
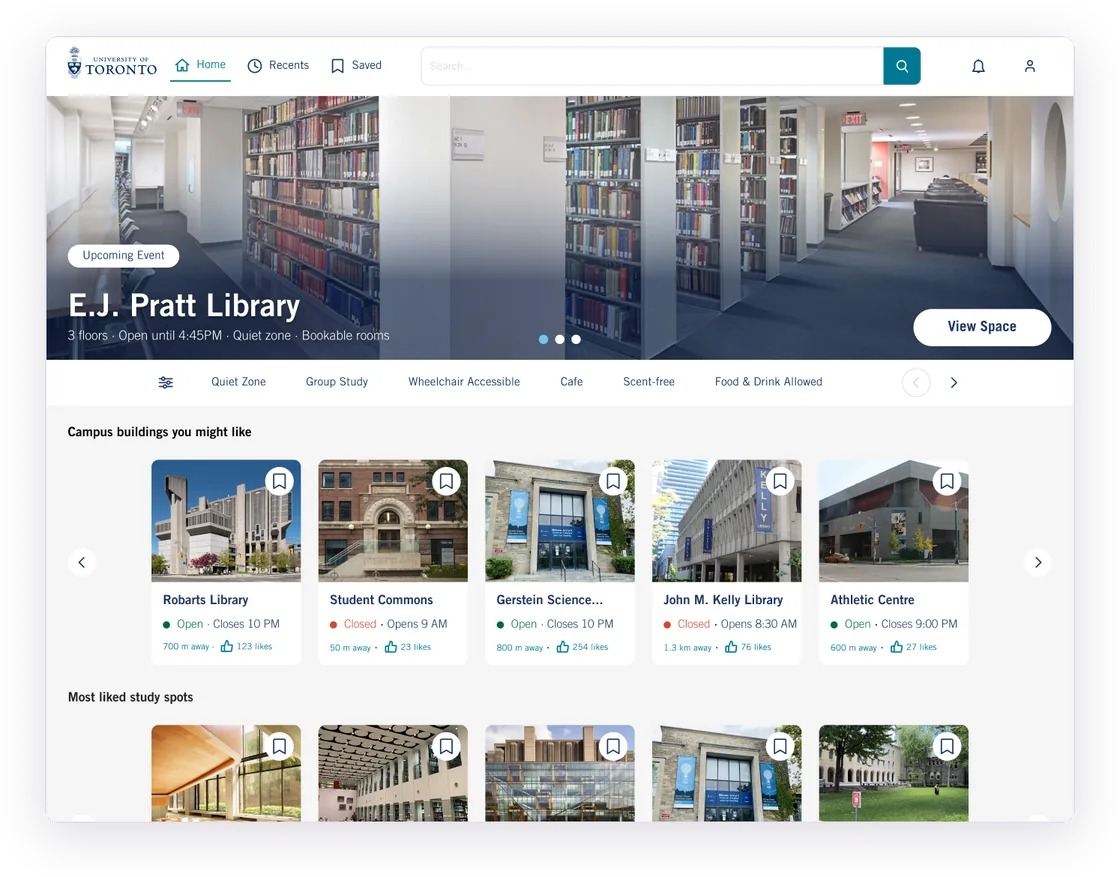
Discovery-based search
For students who aren't sure yet and want to explore spaces through photos, categories and other students' tips.
The prototype I led
A closer look at Option B, the prototype I led.
Because I led Option B, these are the decisions I can speak to best. Each one came from something we learned in research or testing.
Decision 1
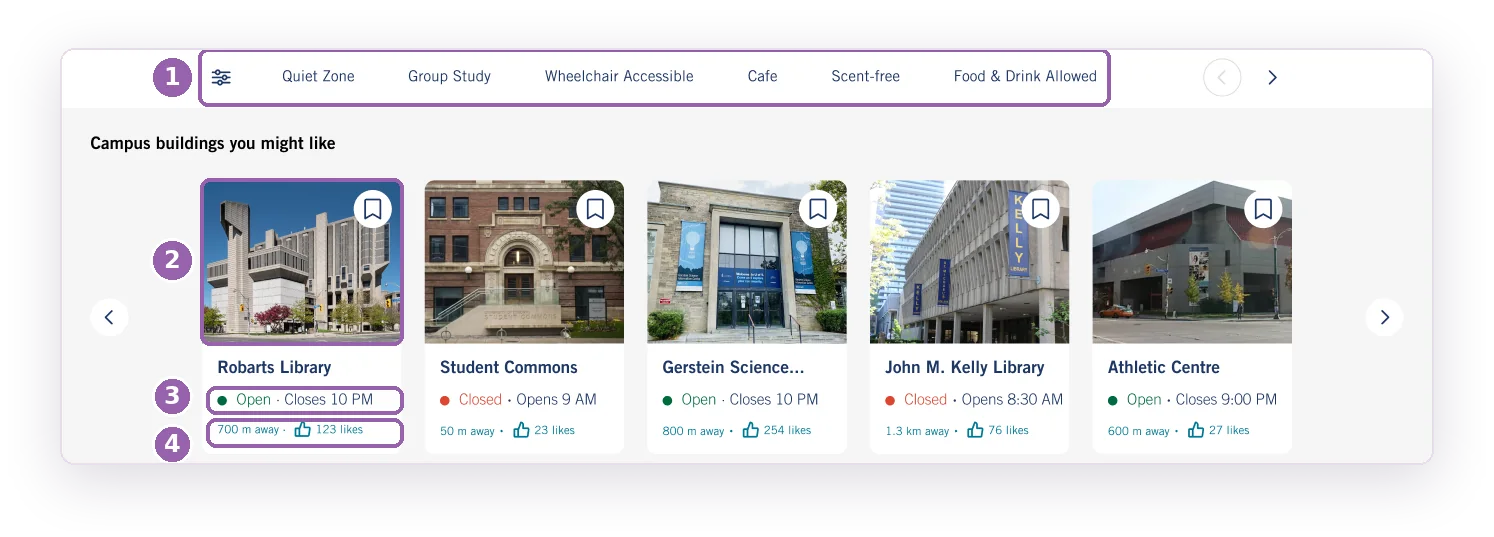
Spotlight building photos so students can decide at a glance.
In testing of the previous prototype, people preferred browsing a visual site with clear icons and text, and they skipped long lists of tags. So each building card leads with a photo and the few facts that decide a visit: whether it’s open, how far away it is and how much other students like it.
Decision 2
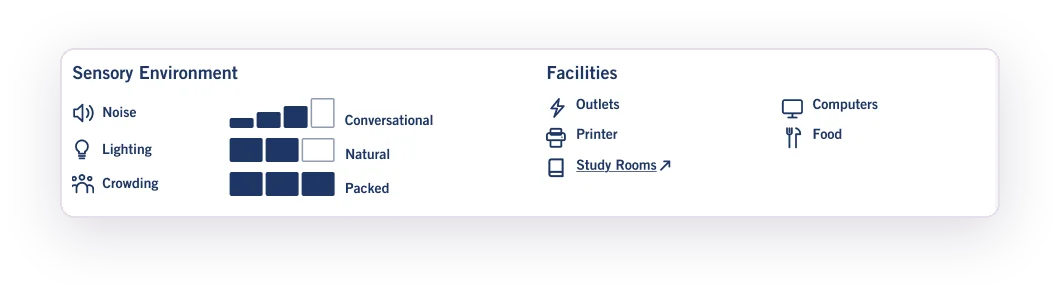
Show sensory conditions as a scale, not a tag.
“Quiet” means different things to different people. We had recorded noise and lighting at every space we visited, so we showed them as meters. That way, each student can judge a space against their own threshold instead of trusting someone else’s label.
Decision 3
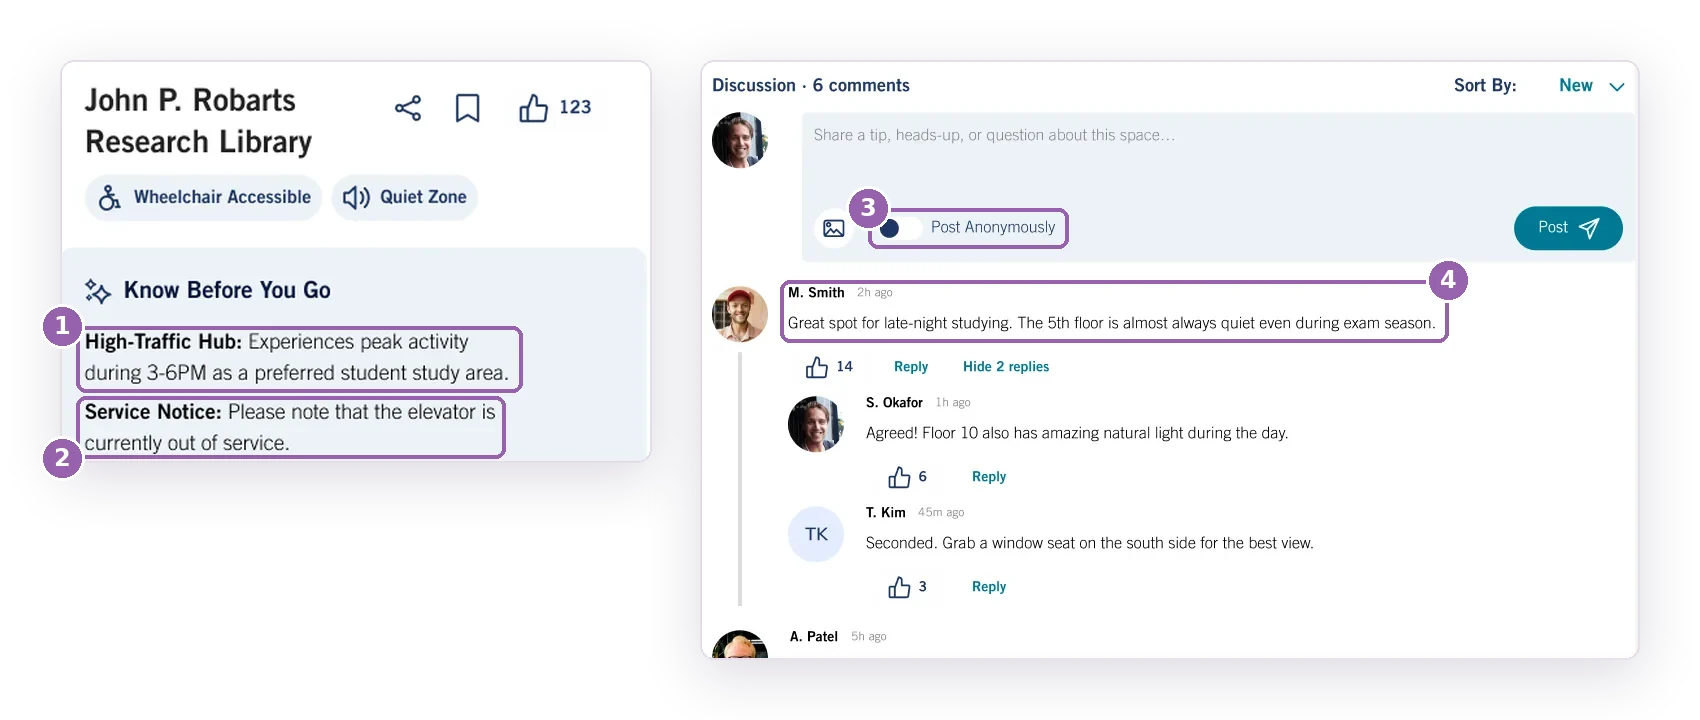
Let students tell each other what to expect.
Some things only other students know: when a space gets busy, whether the elevator is working or which floor stays quiet. A discussion board replaces star ratings, and Know Before You Go turns recent posts into short, AI-generated heads-ups. Testers questioned how current and trustworthy reviews would be, so posts add context; they don’t replace verified hours or access details.
What should an accessible database prioritize? The information, not the entry point.
Both options run on the same needs-based details. Next, I’d A/B test them with students who have invisible disabilities to see which approach helps them decide faster.
03Design system
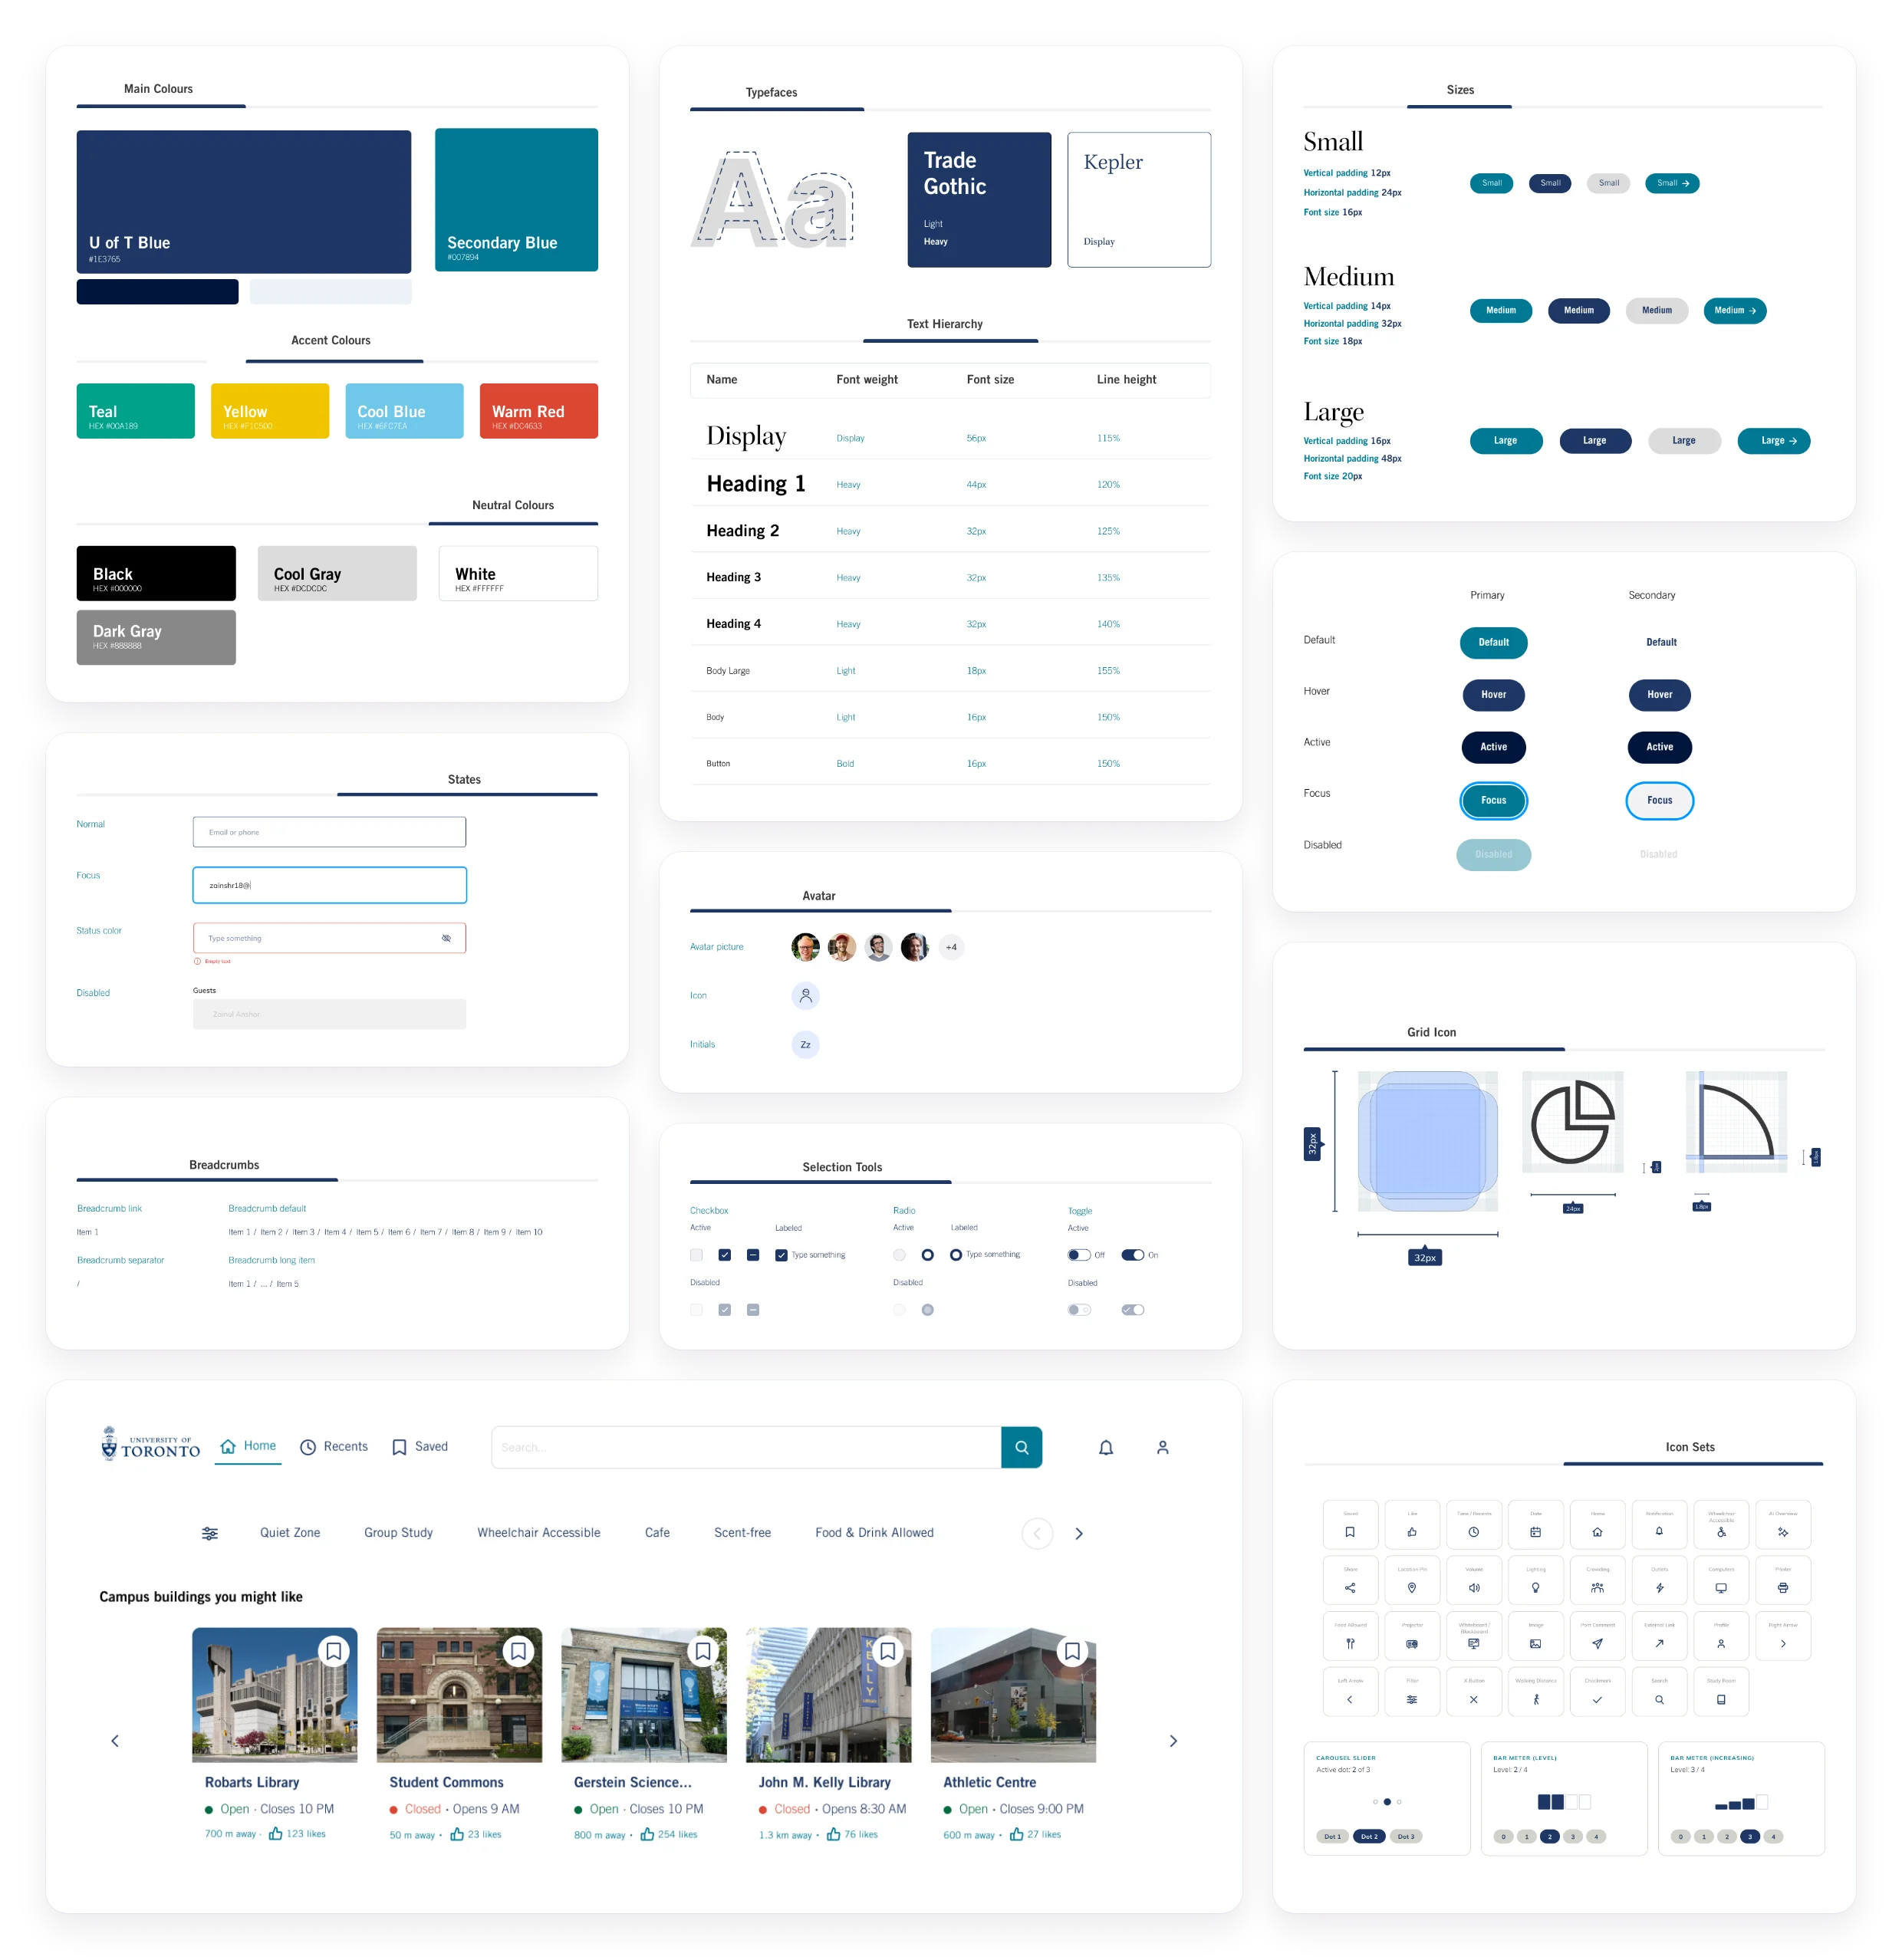
Built on U of T’s brand, extended for product UI.
Two teammates and I designed this system from scratch in Figma, following U of T’s brand guidelines. Colours and type are Figma variables, and every component includes its states, so three of us could design Option B’s 21 screens in parallel without them drifting apart.
Before publishing, fix in Figma and I'll re-export: the "Closed" red (#DC4633) is 4.23:1 on white, under AA's 4.5:1 (use #DA3A26 or darker). The type table lists Heading 3 and 4 as 32px. The grid page says 30px gutters, but screens use 24px.
04Research
Our opportunity: keep the strong discovery tools, and make information simpler, more scannable and easier to decide with.
Our inspiration was a prototype built by a previous team of master’s students. Rather than starting over, we studied what already worked and where current students still got stuck.
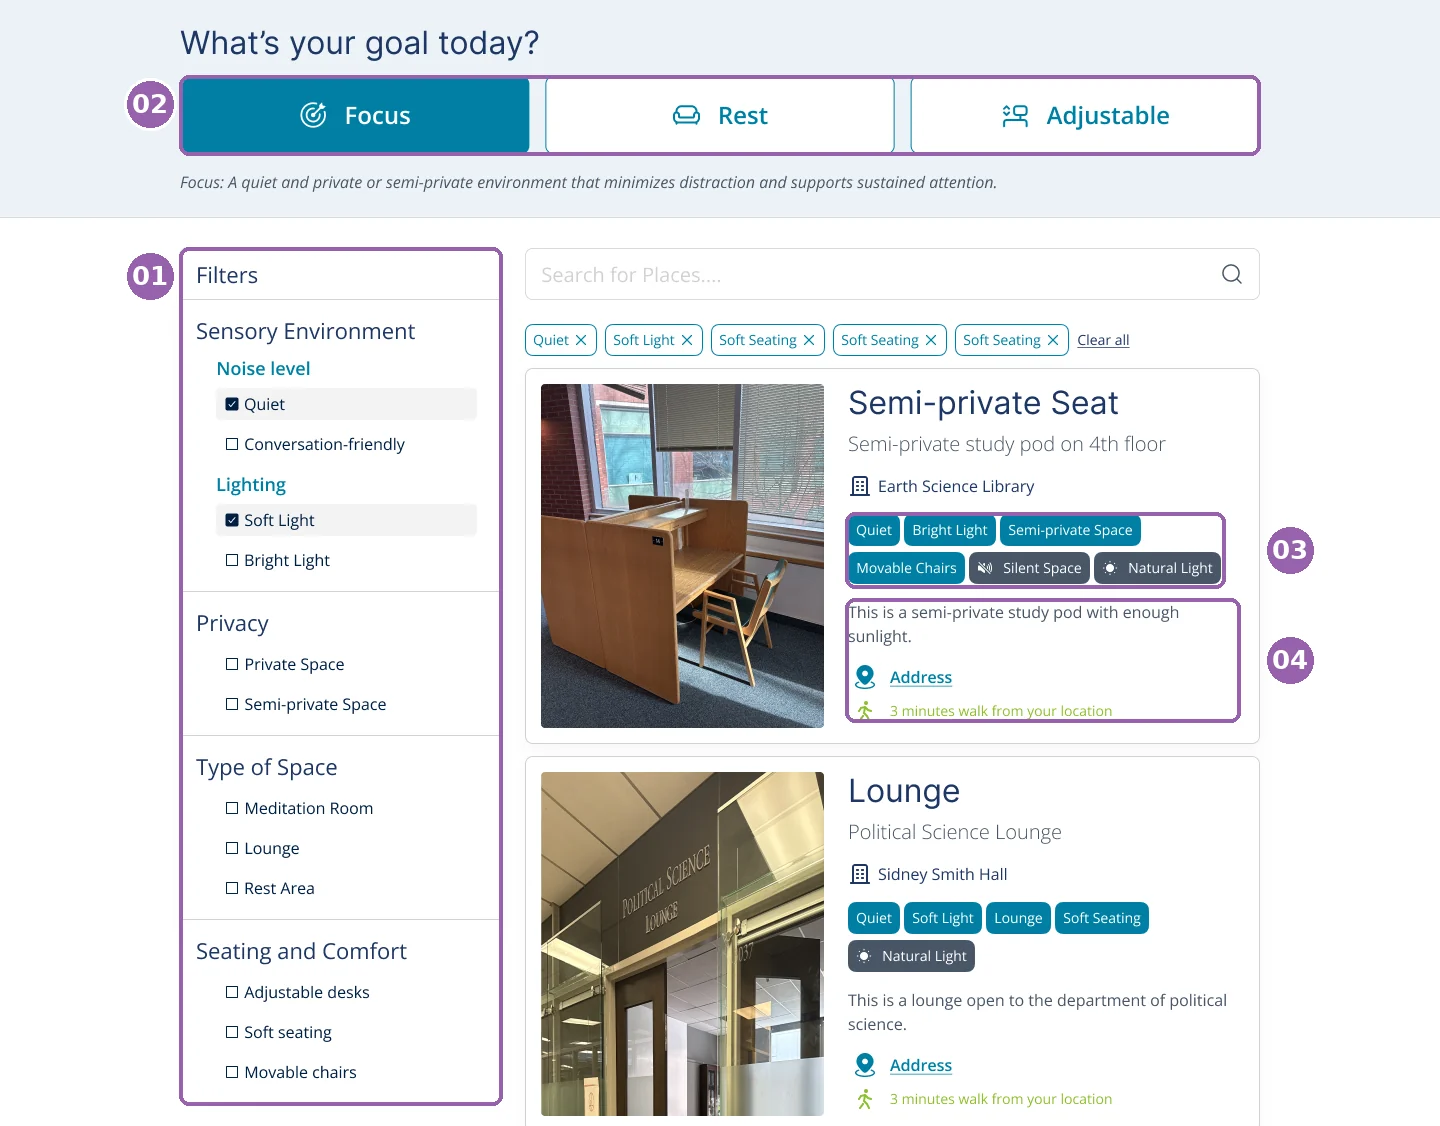
Powerful filtering
Extensive filters helped narrow spaces down.
Quick search
Goal shortcuts reduced the effort.
Information overload
Dense tags made pages hard to scan.
Missing context
There still wasn't enough to decide where to go.
Search by need, not diagnosis.
Three findings from the Innovation Hub’s Signals of Hope report shaped what we prioritized.
Isolation is common
Students with invisible disabilities felt less isolated when they could connect with others who'd had similar experiences.
Led toCommunity tips for all students
Invisible isn't only mental
Chronic pain and fatigue are invisible too, and they're often questioned.
Led toRest, seating and distance details
Inclusion is subtle
Students want to disclose on their own terms.
Led toConditions, not diagnosis labels
campus buildings visited
spaces documented, from noise and lighting to seating and food rules
After testing our checklist on the first day of visits, we found some questions too vague: teammates answered the same question in different ways. So we met to define each quality clearly, which made our data consistent and comparable across all 72 spaces.
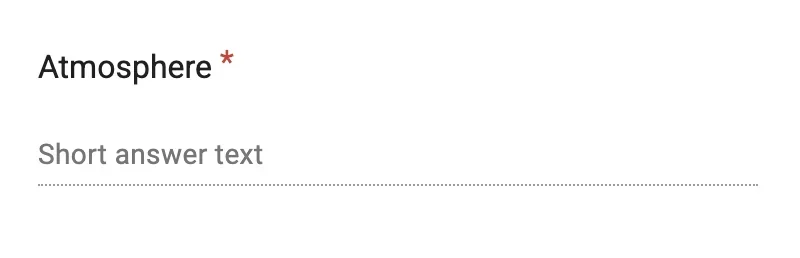
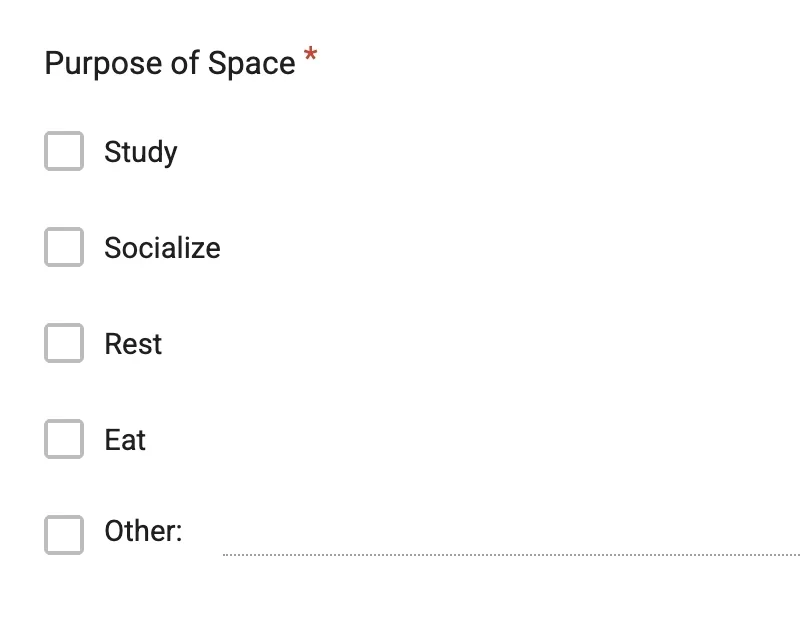
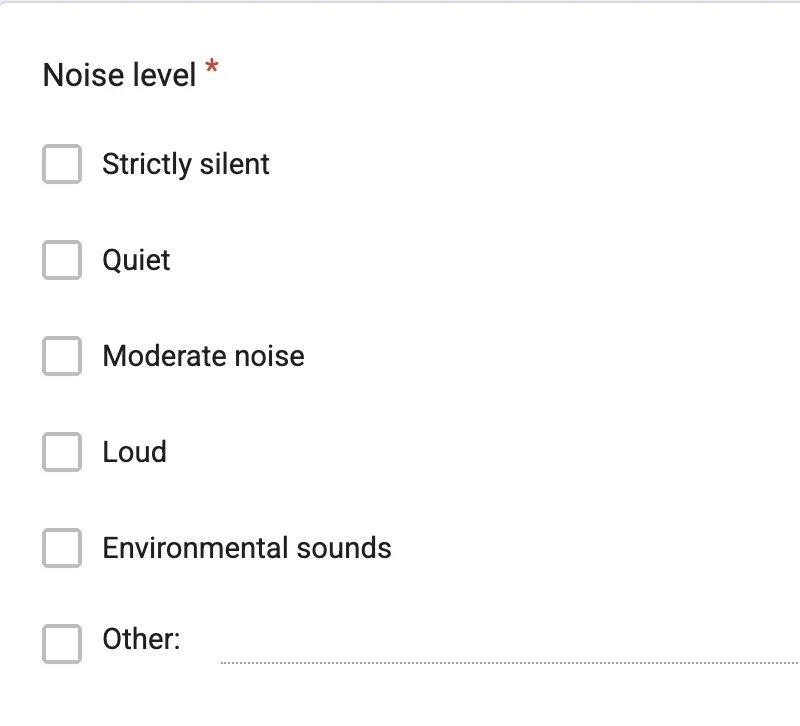
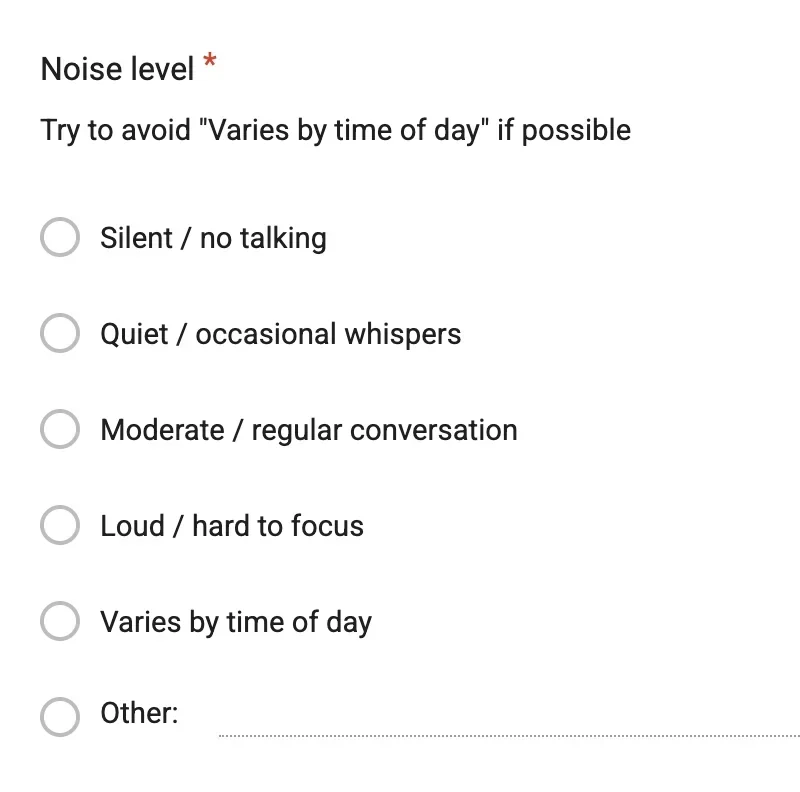
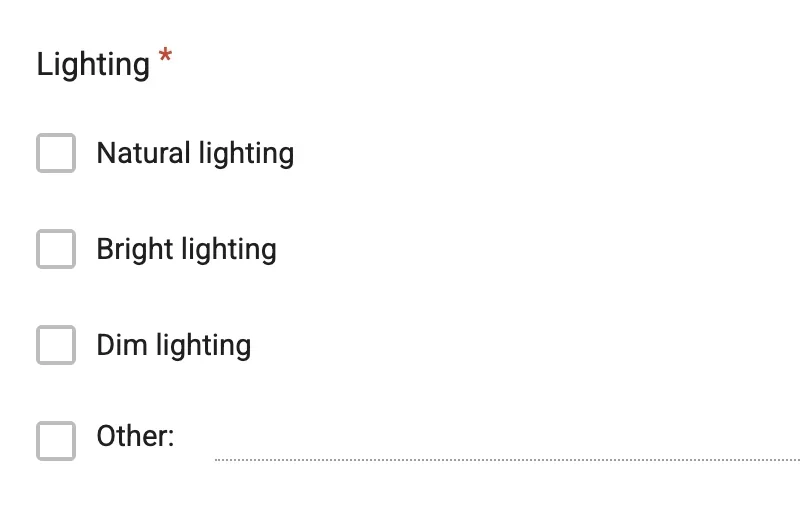
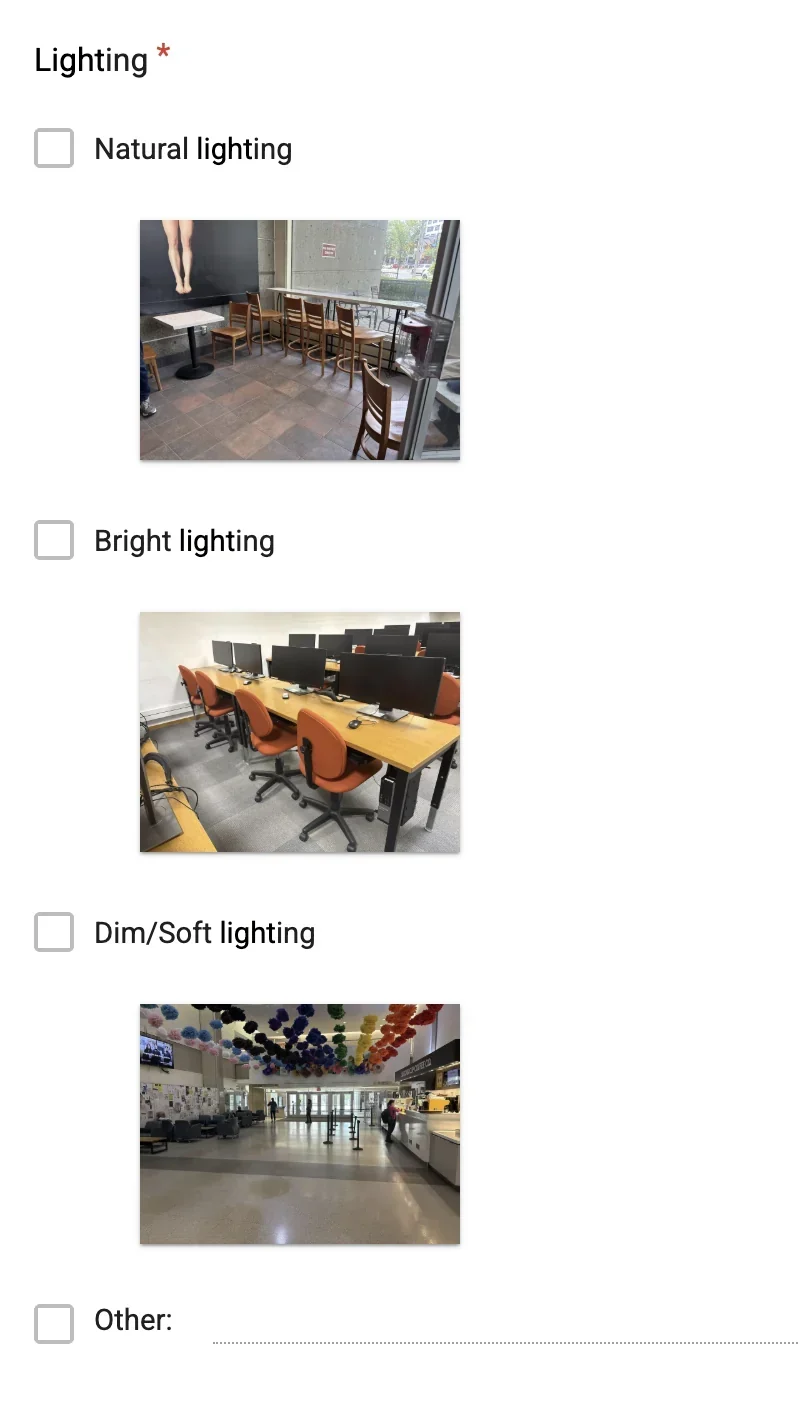
We also removed temperature, since almost every building has heating and AC was hard to confirm, and added missing seating options. Filters are only as clear as the data behind them: these set categories became the Study, Socialize, Rest and Eat shortcuts in Option A and the quick tags in Option B.
05Process
From 44 ideas to 2 prototypes.
ideas from a 30-minute brainstorm, grouped through affinity mapping
features prioritized with an impact vs. feasibility matrix
high-fidelity prototypes, after Crazy 8s and lo-fi and mid-fi rounds
Affinity mapping and prioritization grid
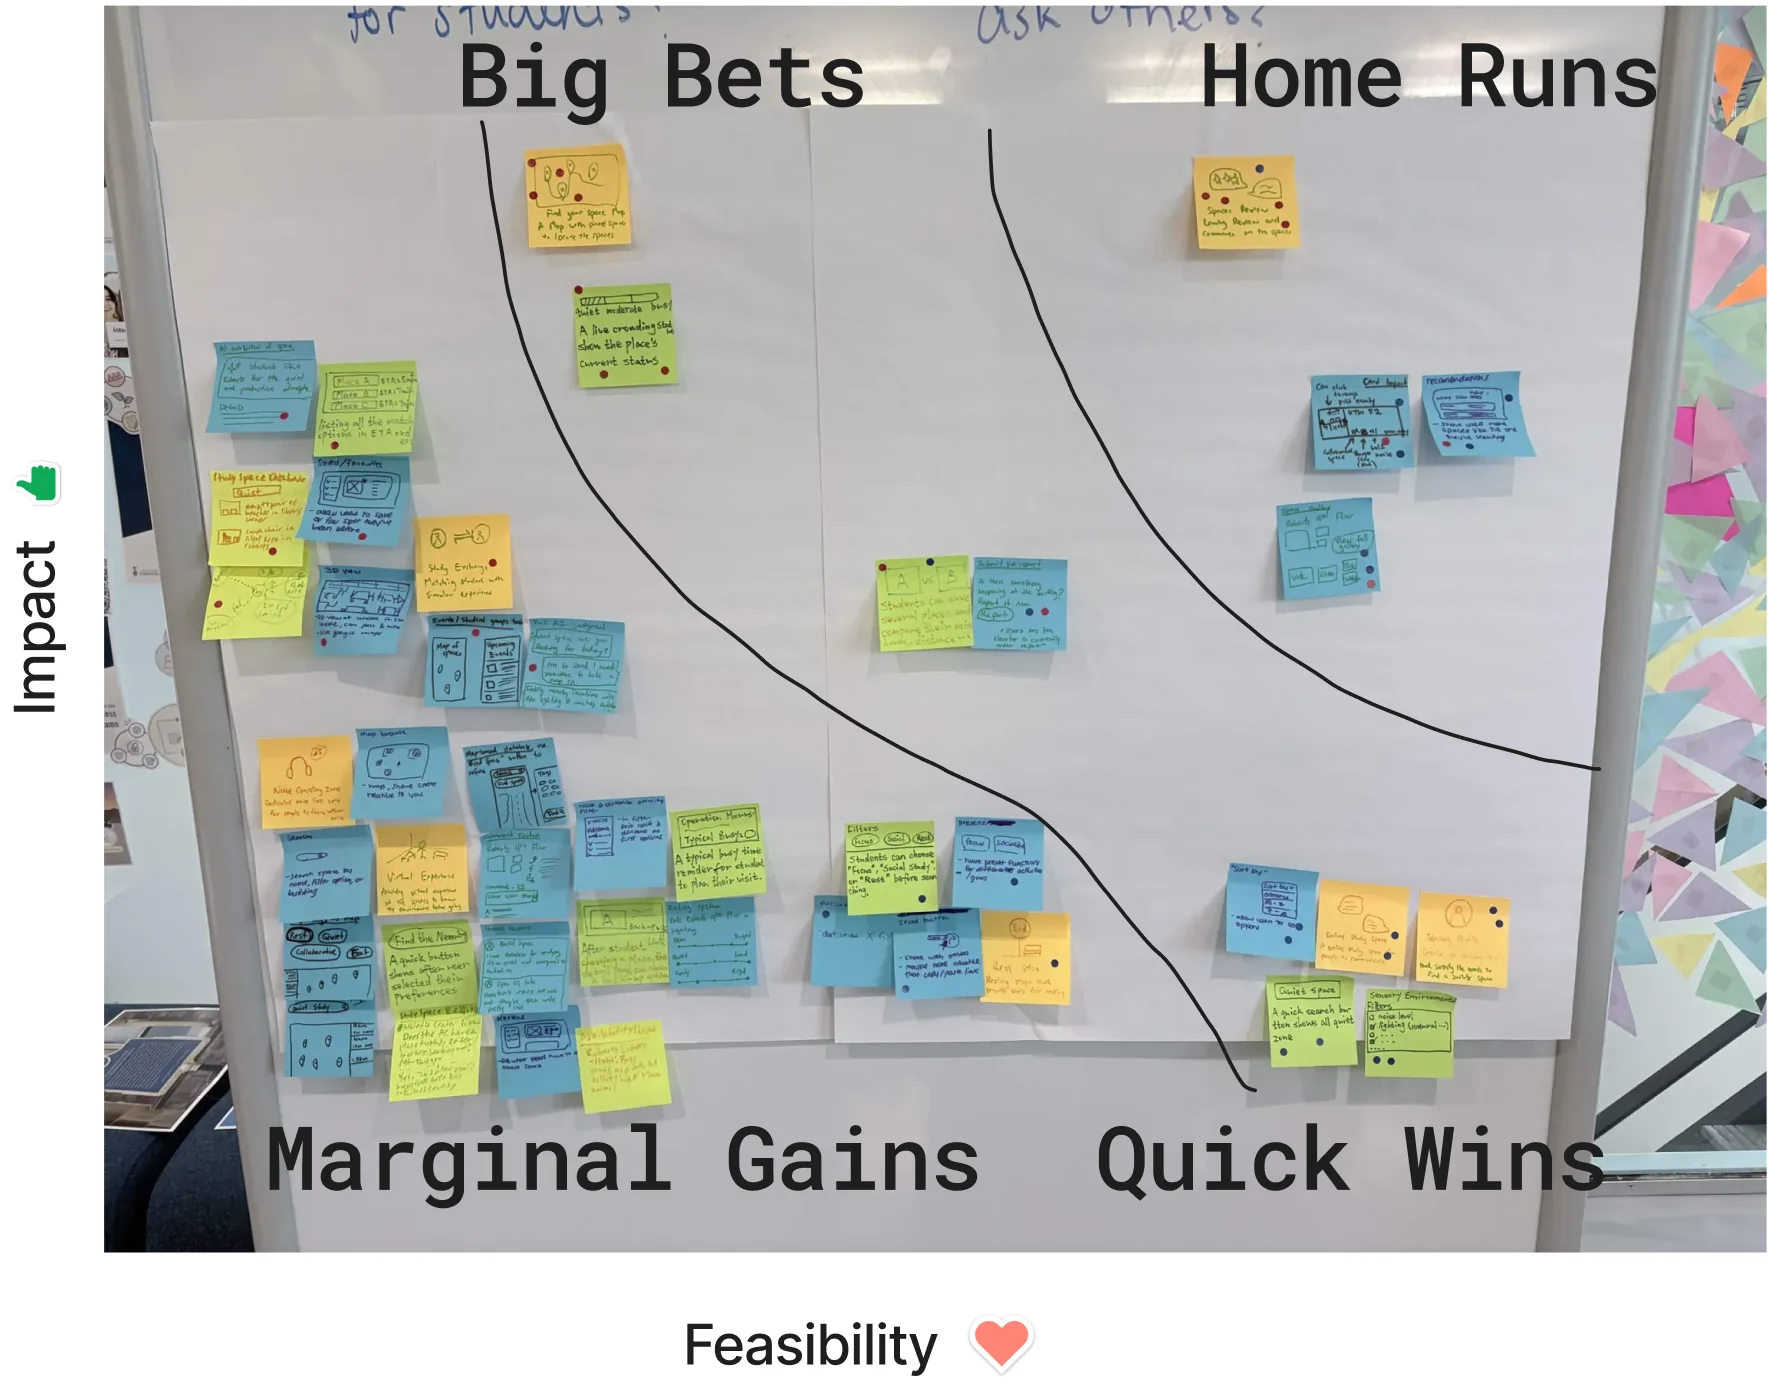
We sorted every idea by impact and feasibility, then did it again.
In 30 minutes, we wrote 44 ideas on sticky notes and grouped similar ones. Each of us then had five impact votes and five feasibility votes. Voting twice helped us drop ideas that sounded exciting but couldn’t be built in two months, and focus on what students needed most.
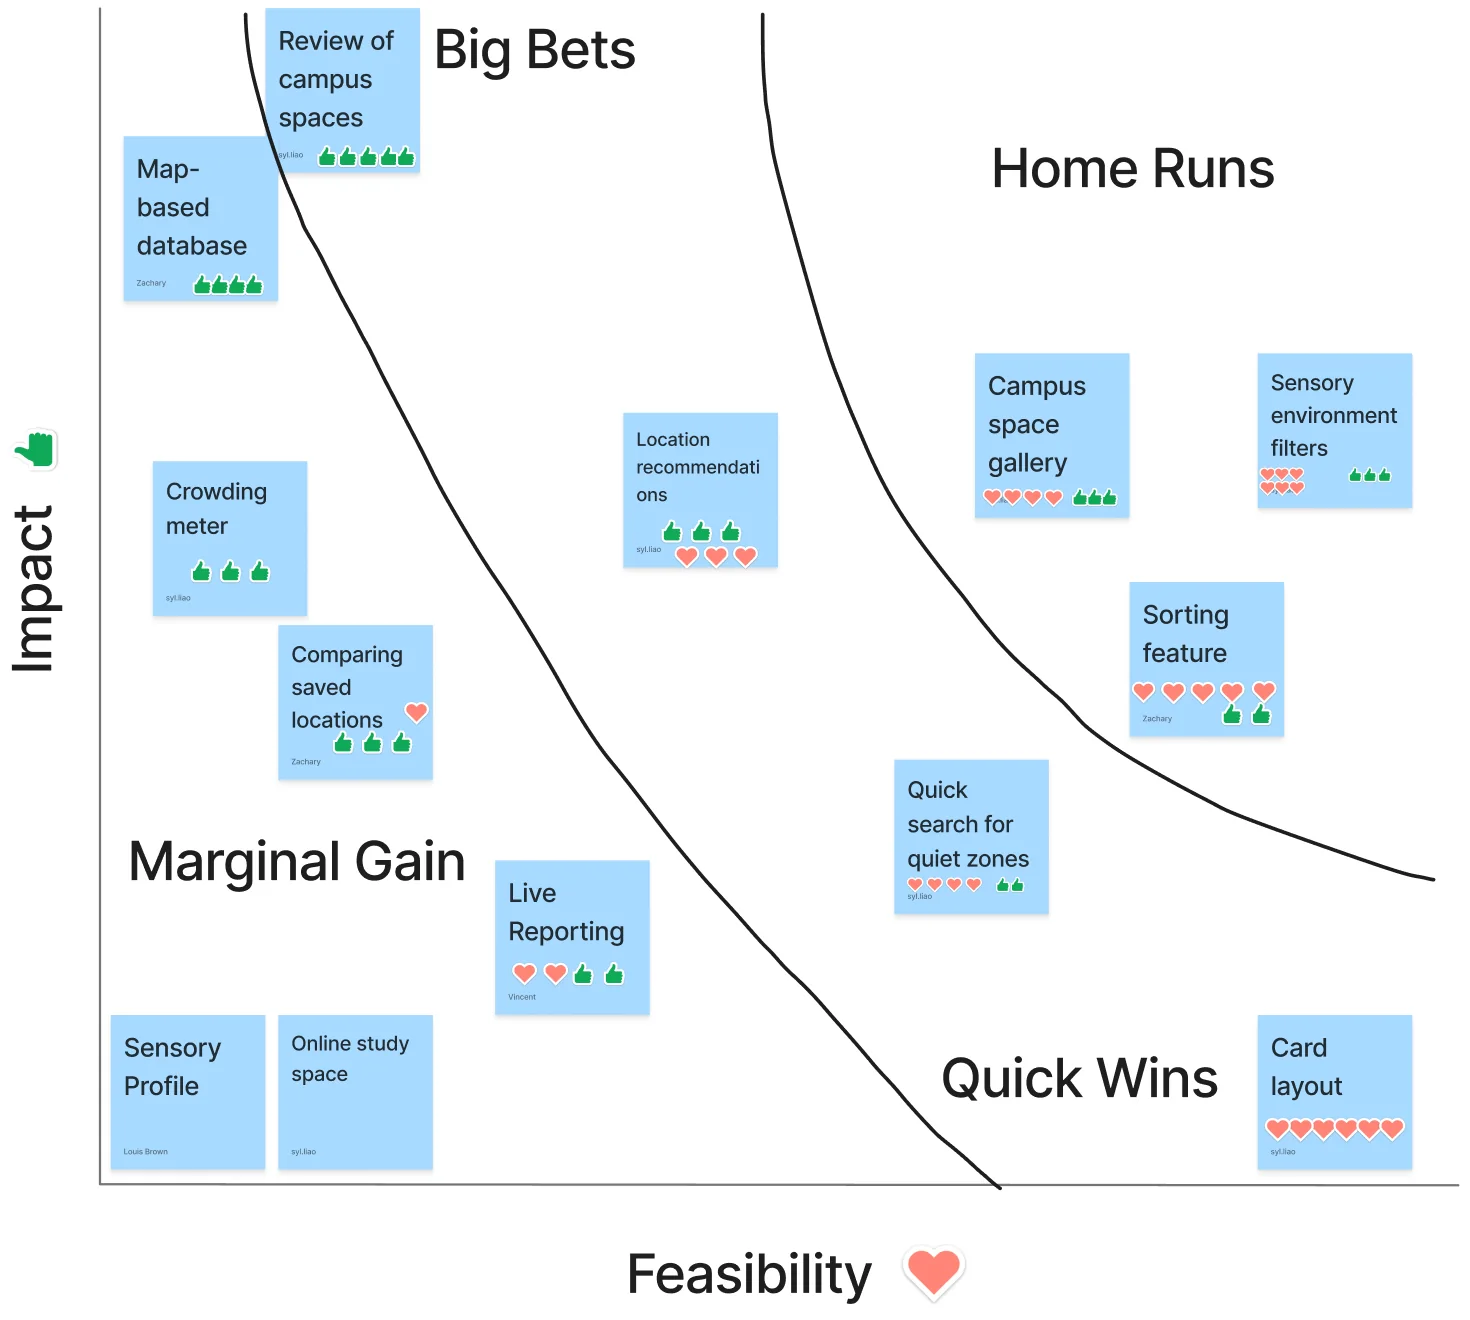
Sensory filters
Moved from quick win to home run. They're the most direct answer to "Will this space work for me?"
Reviews
Moved from home run to big bet. Reviews can be outdated or unverified, so we turned them into tips instead of ratings.
Map view
Dropped from big bet to marginal gain. It was too much to prototype well in our timeline.
Live crowding
Live meters and reports need real-time data that we didn't have.
Crazy 8s
Six of us, six takes on every idea.
My contributionI facilitated Crazy 8s on the 13 ideas from our first round, with two minutes per sketch. Seeing six versions of each idea side by side helped us spot the strongest layouts before anyone committed to one.
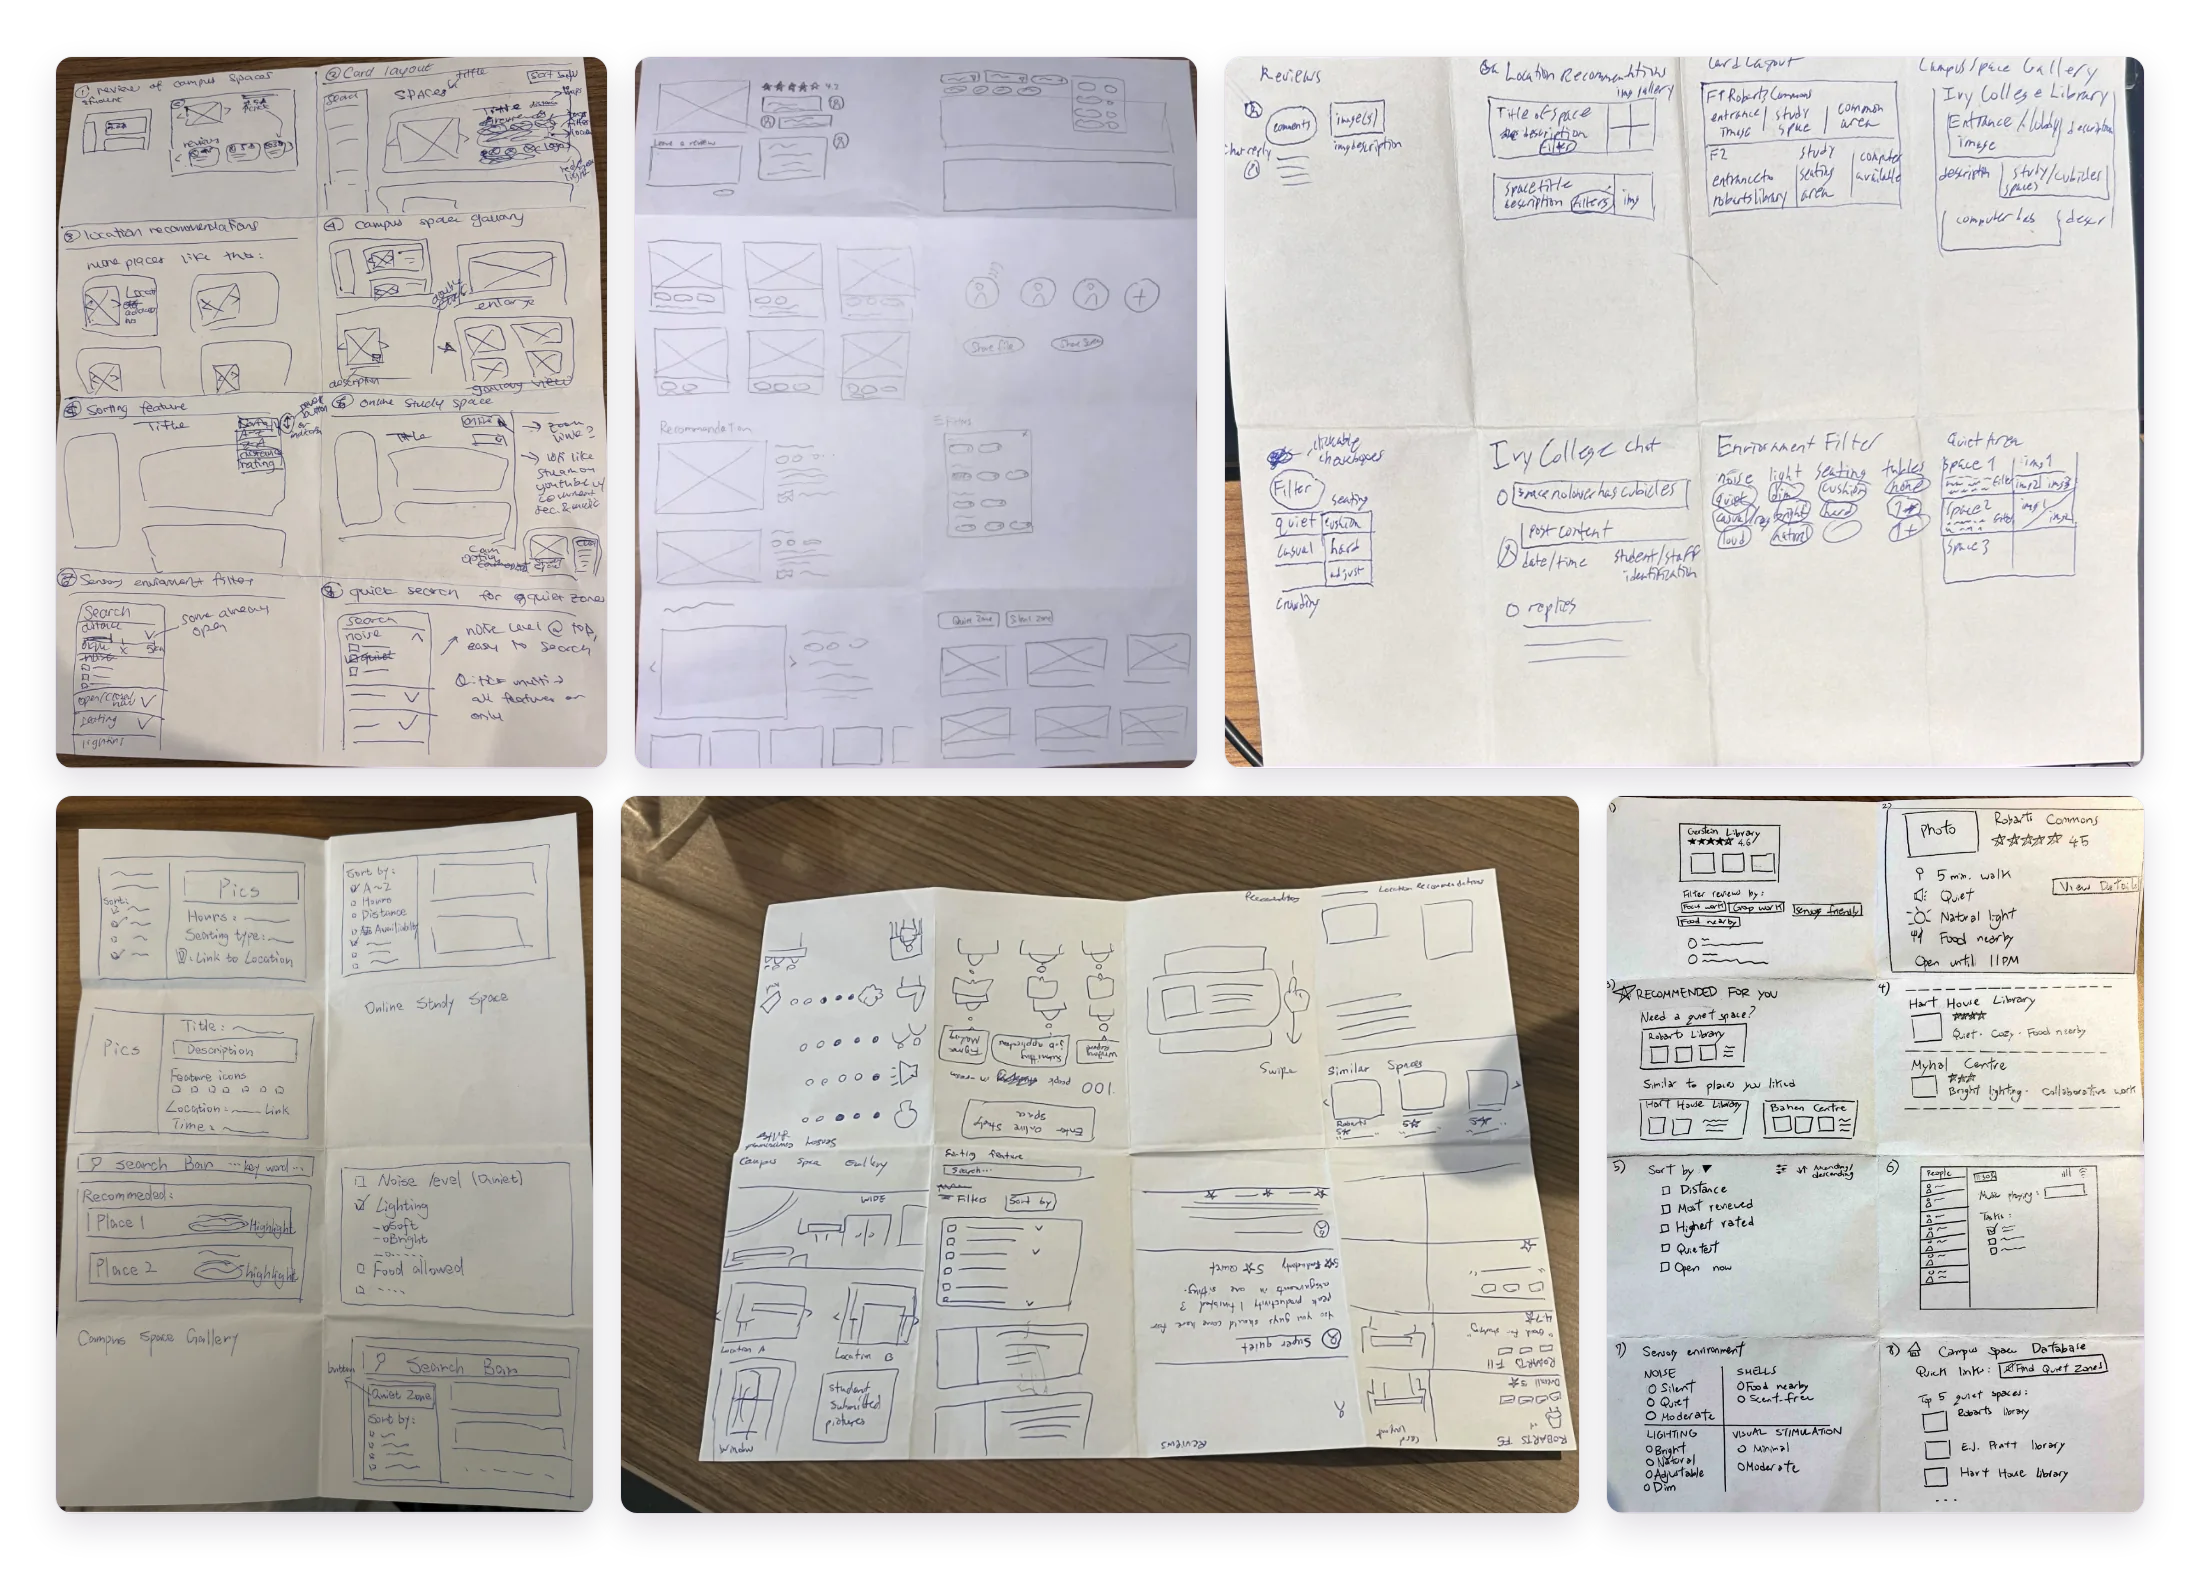
One lesson: we all sketched from the same grid, so our six lo-fi concepts came out too similar.
Next time, I’d have everyone sketch once before seeing the shortlist, so our early concepts stay more varied.
06Testing
Feedback made it simpler.
Walkthroughs with Innovation Hub members and a review from our supervisor led to four changes. Each one made the prototype easier to scan or easier to trust.
More buildings
We added three building pages beyond Robarts, so testers could compare real options.
Fixed bugs
We fixed filter deselection and inconsistent font sizes.
Better sorting
We added alphabetical sorting next to most liked and distance.
Cut scope
We removed an online study space and made events secondary, to keep the focus on physical spaces.
Add one before-and-after pair here, e.g. the building page before and after it was simplified.
07Outcome
The Innovation Hub is pitching our prototypes to U of T leadership.
Their honest feedback: Option B drifted toward students in general and away from students with invisible disabilities.
Looking back, I’d fix this in three ways. I’d check every screen against our need statements during design reviews, so drift gets caught early. I’d lead the home page with access information, like quiet, low-light and seating categories. And I’d recruit testers who identify with invisible disabilities, for example through Accessibility Services, since none of ours were screened.
Check "U of T leadership" matches what the Innovation Hub said.
08Reflection
What I learned
Small decisions carry access.
A label, an icon or a scale can decide whether someone is able to use a product at all.
Don't latch onto one idea.
Designing two options showed me there's rarely one right answer, only answers that fit different needs.
Test with the people you design for.
None of our testers were screened for invisible disabilities. Next time, they come first.
Systems make teams faster.
Once our system existed, three of us built 21 screens that still felt like one product.